


Australia’s 1,241,037-unit new-vehicle market in 2025 didn’t just deliver a record sales year, it also confirmed a significant shift in where the vehicles Australians are buying are being built.
The biggest change over the last decade is the rise of China as a manufacturing source for the Australian market, something plain to see in annual VFACTS sales reports.
In 2015, Australia’s total market was 1,155,408 vehicles. Japan was the dominant source country at 335,288 deliveries (29.0 per cent share), Thailand was second on 249,804 (21.6 per cent), and Korea followed with 140,172 (12.1 per cent).
China was a fringe contributor, ranked 21st among source countries with just 2320 deliveries, or 0.2 per cent of the overall market. An initial surge of Chinese brands in Australia, starting with Great Wall in 2009, had largely petered out by the mid-2010s.
CarExpert can save you thousands on a new car. Click here to get a great deal.

But a resurgence from Chinese automakers was just around the corner, and by 2024, China’s rise was already well established.
Thailand still held onto second place in 2024, but Chinese-built vehicles totalled 192,839 (15.6 per cent share) in a 1,237,287-unit market, while Thailand delivered 272,139 (22.0 per cent). Japan remained number one at 378,911 (30.6 per cent), and Korea recorded 157,760 (12.8 per cent).
By 2025, that picture tightened dramatically and then flipped. Chinese-made vehicles climbed to 252,928, equal to 20.4 per cent of the total market, elevating China to second place overall.

China finished 2025 just 2,970 units ahead of Thailand, which delivered 249,958 (20.1 per cent). Japan remained number one at 358,981 (28.9 per cent), and Korea stayed fourth with 149,966 (12.1 per cent).
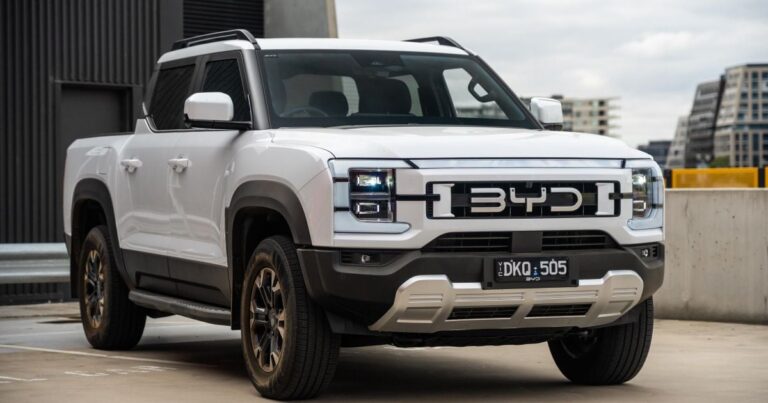
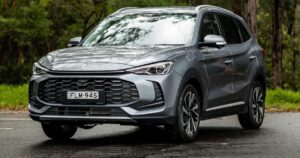
This figure from China was supported by not only Chinese brands such as BYD, Chery, GWM and MG, but also the likes of Tesla (which only sells Chinese-built vehicles in Australia) and other brands such as BMW and Volvo.
The near-term movement shows how quickly the change happened. From 2024 to 2025, China increased by 60,089 deliveries, while Thailand fell by 22,181. Over the same one-year span, Japan dropped by 19,930, Korea declined by 7,794, and the total market was up 3,750 units.
The decade-to-decade movement shows how dramatic the China shift has been. Between 2015 and 2025, China increased by 250,608 annual deliveries. Thailand’s total was essentially unchanged over the same span (up 154), while Japan increased by 23,693 and Korea by 9,794.
The overall supply mix also became more concentrated as Japan, Thailand, Korea and China together moved from 727,584 deliveries in 2015 (63.0 per cent of the total market) to 1,011,833 in 2025 (81.5 per cent). That concentration shift is largely the story of China becoming a top-tier source country.
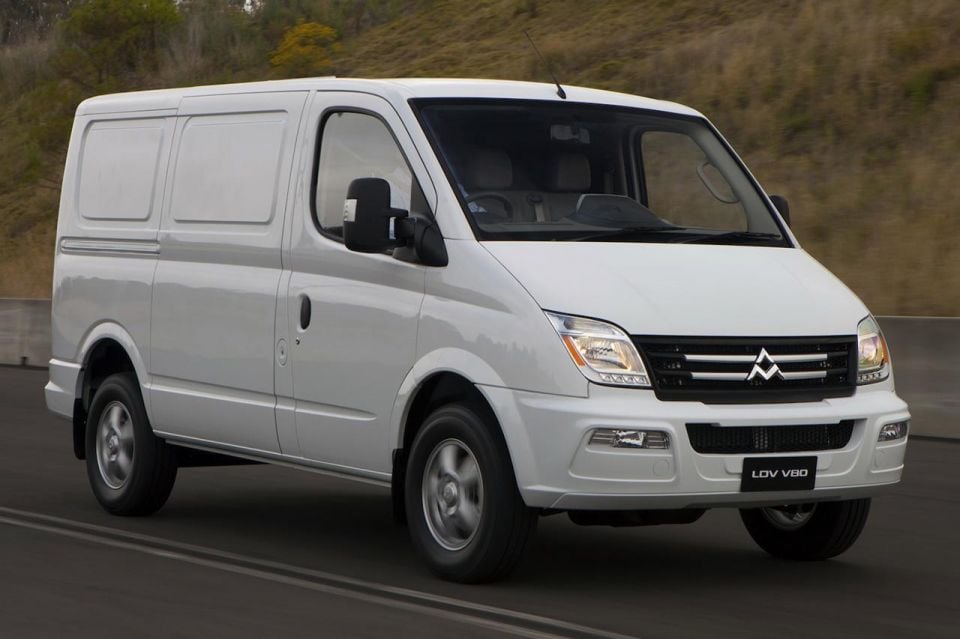
In 2015, Chinese-nameplate volume was small. GWM recorded just 142 sales (though it record 2637 in 2014), Chery registered 201, and LDV delivered 767. In that year’s official sales data brands like MG, BYD and Zeekr didn’t exist.
In 2025, those lines look very different: BYD delivered 52,415 vehicles, GWM recorded 52,809, MG posted 41,298, Chery reached 34,889, LDV totalled 14,108, and Geely added 5,010. Other Chinese-built vehicles came from Tesla (28,856), Polestar (2373), and Zeekr (1994).
With even more Chinese-made utes due to come to Australia (and the Korean-made Kia Tasman launching here last year), could Thailand start to get smaller on the list?
With 249,958 deliveries in 2025 and with key players like the Ford Ranger and Toyota HiLux continuing manufacturing there indefinitely, that seems unlikely.
The key shift is that Thailand is no longer the uncontested number-two source country it was in 2015. China’s rapid rise made 2025 a genuine crossover year, as Thailand still led China by 79,300 units in 2024.
Europe’s supply picture is more mixed, but several major European source countries contracted over the decade.
Germany fell from 87,894 in 2015 to 54,905 in 2025 (down 32,989), while England dropped from 32,084 to 12,496 (down 19,588). Spain declined from 17,657 to 5,880 and France from 7,560 to 3,839.
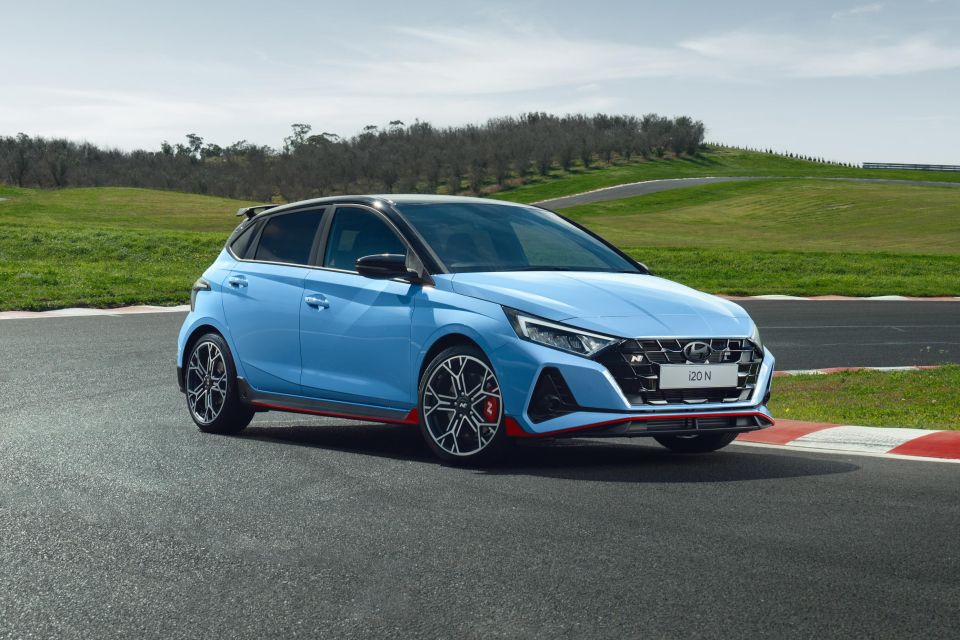
There were exceptions going the other way: Türkiye increased from 3,812 to 10,562 (driven by models like Ford Transit vans and the Hyundai i20 N and Toyota C-HR), and Portugal rose from 367 to 5159 (all Volkswagen T-Rocs).
Across the Americas, the United States eased from 58,104 in 2015 (5.0 per cent) to 31,912 in 2025 (2.6 per cent), while Mexico climbed from 5,238 to 19,281 and entered the top 10 source countries by 2025. Examples of Mexican-built cars currently sold in Australia include the Audi Q5 and Kia K4.
Although local manufacturing for Ford, Toyota, and Holden was still ongoing in 2015 (though it was announced to end), Australian-made cars accounted for 97,443 of total sales. That figure is now zero.
Top source countries: 2015 vs 2025
Below is a breakdown of the top 10 countries by sales volume in both 2015 and 2025.
Note that not all brands report their sales to VFACTS. Examples of brands that have never reported sales include Mahindra and Xpeng.
| Rank | Country | Sales (2015) | Country | Sales (2025) |
|---|---|---|---|---|
| 1 | Japan | 335,288 | Japan | 358,981 |
| 2 | Thailand | 249,804 | China | 252,928 |
| 3 | Korea | 140,172 | Thailand | 249,958 |
| 4 | Germany | 87,894 | Korea | 149,966 |
| 5 | USA | 58,104 | Germany | 54,905 |
| 6 | England | 32,084 | USA | 31,912 |
| 7 | South Africa | 20,401 | Mexico | 19,281 |
| 8 | Czech Republic | 18,093 | South Africa | 12,612 |
| 9 | Spain | 17,657 | England | 12,496 |
| 10 | India | 13,901 | Turkey | 10,562 |
Fuel mix (light vehicles): 2015 vs 2025
| Fuel type | Sales (2015) | Sales (2025) |
|---|---|---|
| Diesel | 334,052 | 364,605 |
| Electric | 1108 | 72,041 |
| Hybrid | 12,138 | 199,133 |
| Petrol | 773,865 | 475,279 |
| LPG | 2,061 | – |
| Hydrogen | – | 2 |
| PHEV | No data available | 53,484 |
MORE: VFACTS 2025: Another record year for new vehicle sales in Australia, but growth modest overall
Source link